箱线图和点柱图的融合图怎么做?
最近遇到了这样一个提问:
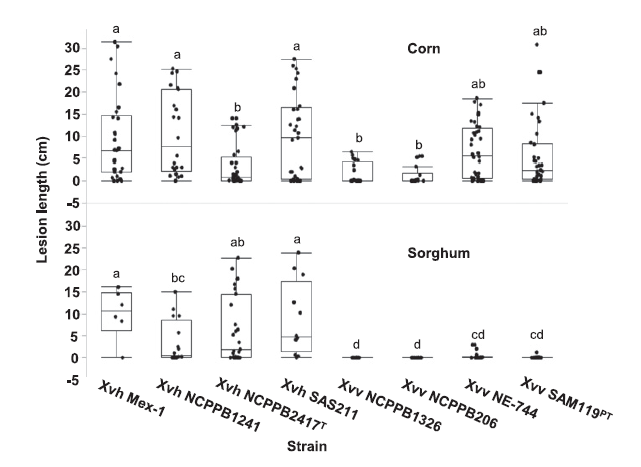
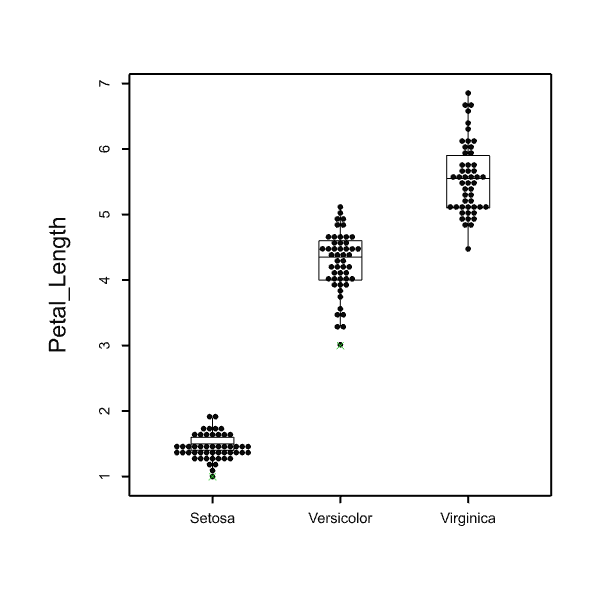
I would like to enquire if it is possible to produce the graph below in Genstat (a fusion of a box plot with dot histogram)?
在Genstat中 可以做这种箱线图和点柱图的混合图么?

答案是: Of course, Genstat当然可以。
Step by step
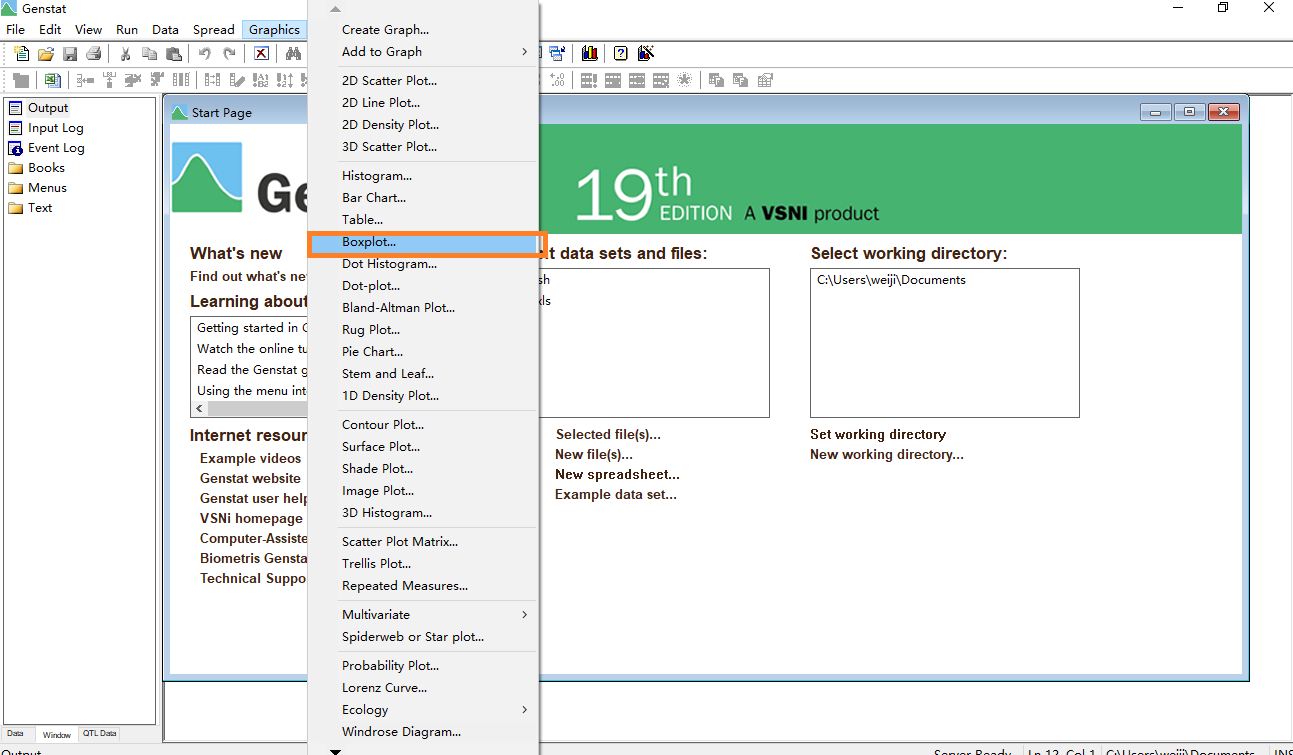
1、Generate a boxplot using the Graphics > Boxplot menu(先做一个箱线图)

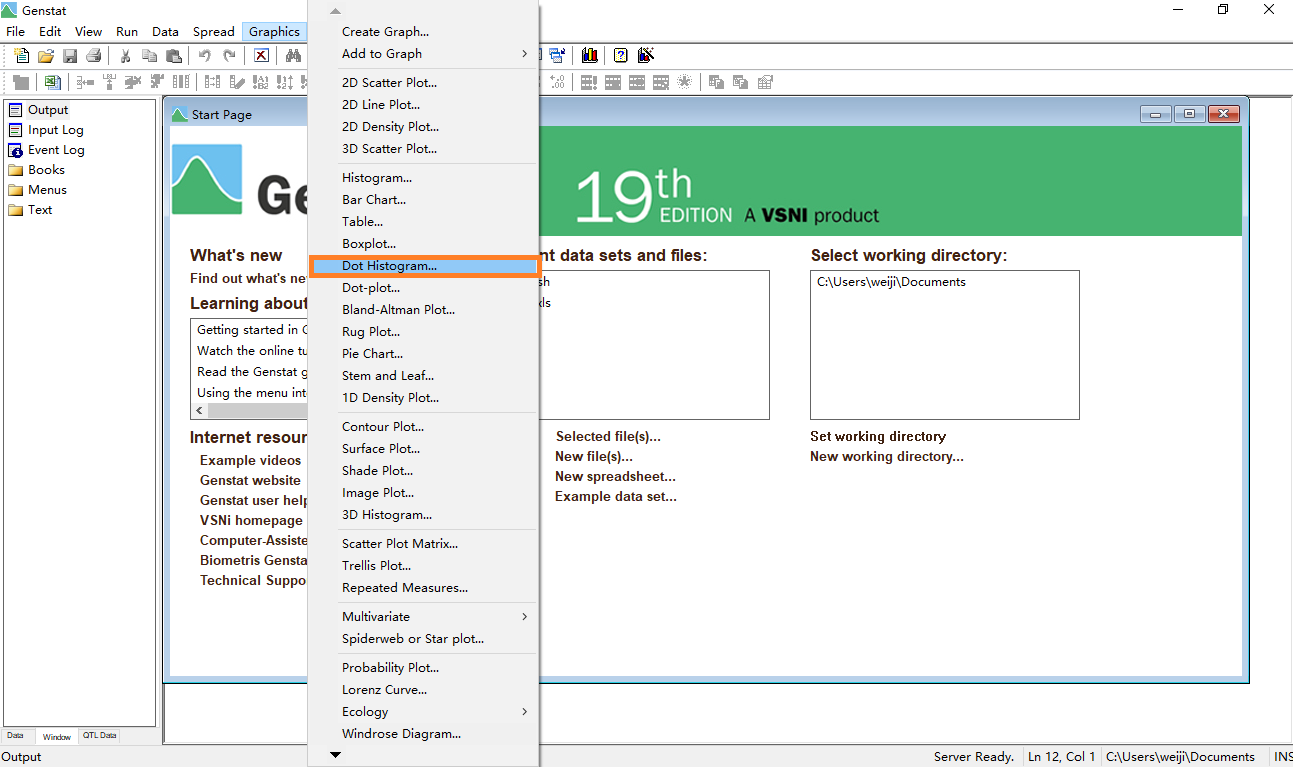
2、Once the boxplot is generated, go to the Graphics > Dot Histogram to draw a dot histogram (同样的方法,再做一个点柱图)

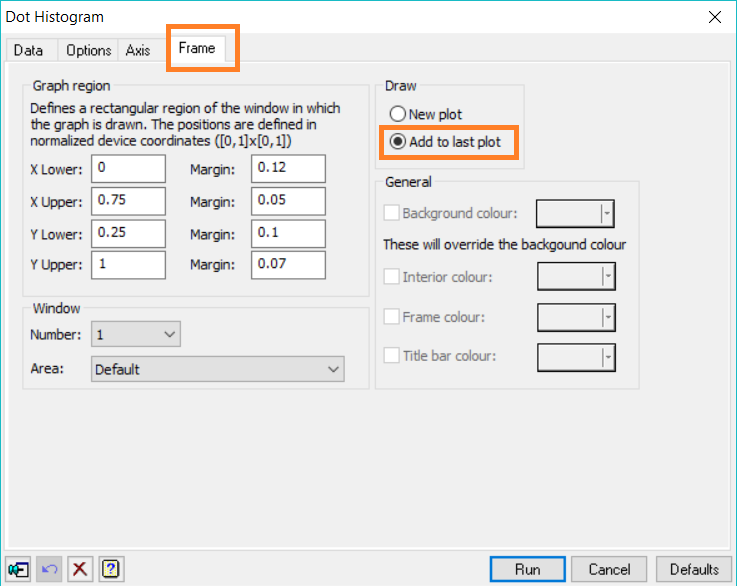
3、Specify the data to be plotted (it should be the same for both graphs) in the Data tab, then go to the Frame tab. (两个图做好后,前往箱线图的Data tab, 选择Frame tab)
4、In the Draw box on the right-hand side of the Frame tab, select Add to last plot option to add the dot histogram to the boxplot. (选择Add to last plot)

5、The graph will be then generated. (混合图就生成了,就是这么简单!)
如果您对Genstat软件、数据分析或培训感兴趣,欢迎联系我们010-62680244/China.vsni.co.uk。