The IBP Breeding Management System (BMS) is a comprehensive and easy-to-use software suite designed to help breeders conduct their routine activities with more efficiency, so that they may develop improved cultivars faster and at lower cost. It combines information management, data analysis and decision-support tools that accommodate common breeding schemes, from conventional breeding through increasing levels of marker use, providing all the tools they need in just one place.
Database Integrated Tools
The Breeding Management System (BMS) contains database-integrated tools that seamlessly connect to the crop database when launched from an established Workbench program. Database integration minimizes the need to manually create, save, and import files as you move through a breeding programme. When these tools are launched through the Workbench, selected data moves seamlessly from the database to the application.
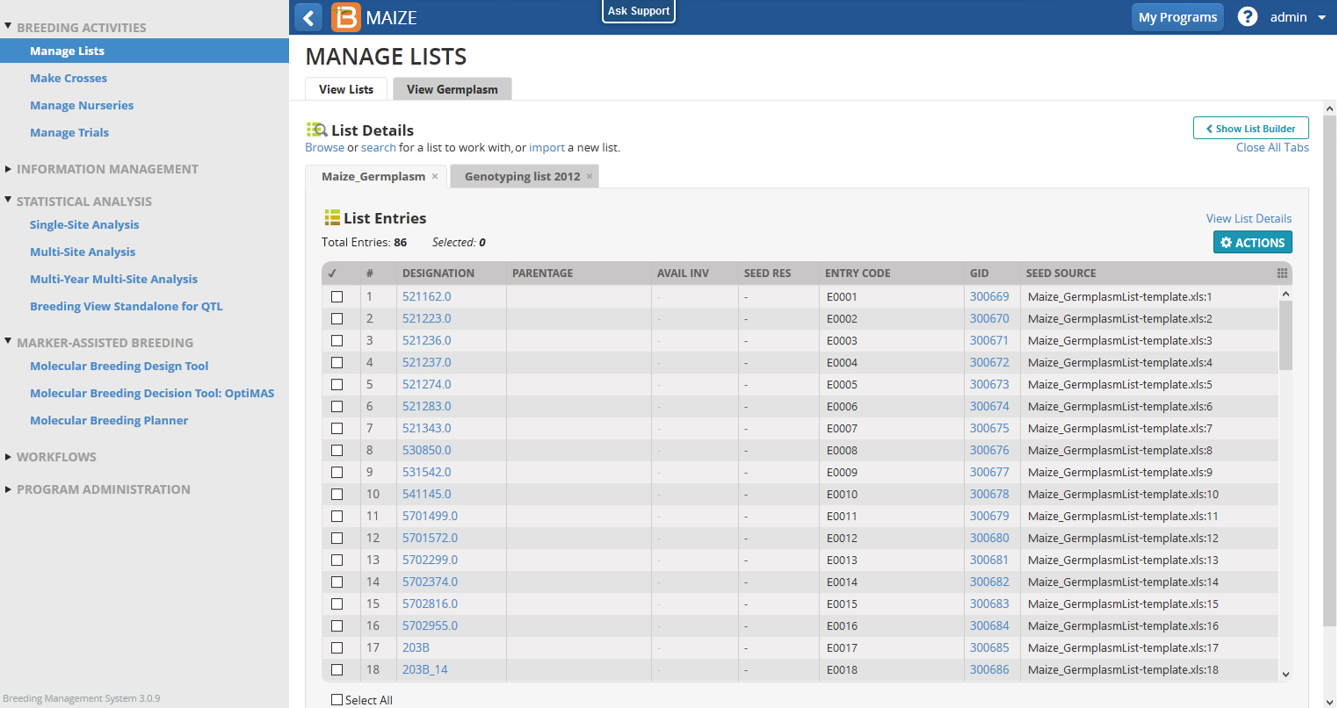
- Germplasm List Manager: Browse, search, and filter germplasm to create custom lists
- Breeding Manager: Design crosses, advance generations, and select progeny
- Genotype Database Manager: Connect germplasm to genotype data
- Nursery Manager: Design, manage, and advance nurseries
- Trial Manager: Design and manage field trials
- Statistical Analysis (Breeding View): Analyze phenotypic data, single site, and multi-site analyses
- Molecular Breeding Design Tool: Select target genotypes for marker-assisted backcross breeding (MABC) and determine optimal population sizes for each generation
Tools without Database Integration
These tools, even when launched from the workbench, are not automatically preloaded with selected data. Data files must be created, saved, and imported into these tools.
- Multi-Site Multi-Year Analyses
- QTL Analysis (Breeding View): Identify quantitative trait loci
- Molecular Breeding Planner: Match breeding goals and crop genetic considerations to marker-assisted breeding programmes
- Decision support tool for marker-assisted selection (OptiMAS): Generate a target genotype by predicting the recombination of favorable QTL into a target genotype
Breeding View
Setting the standard for statistical analysis in plant breeding
In modern plant breeding today, breeders have an increasing amount of data to analyse and need to make rapid decisions.
Breeding View (BV) links an easy user interface to a statistical analysis package allowing rapid phenotypic and genotypic analyses of field trial observations. Results include:
- summary statistics
- adjusted means of all traits
- mixed model comparisons of genotypes and locations
All through a set of simple, visual and easy-to-use analytical pipelines and quality insurance measures.
Analytical pipelines
These pipelines are presented as graphical workflows where you can choose to run the complete pipeline at once, or to run each separate element of the pipeline. Each element of each pipeline has a set of default statistical parameters which can be modified by the user before an analysis.
Results of each analysis are saved in a time stamped folder in your personal workspace or, for the phenotypic analysis, can be saved to the BMS database for later review or further analysis. The phenotypic analyses are fully integrated into the BMS so that data can be selected in the BMS and sent to Breeding View for analysis, and resulting means and summary statistics saved back to the BMS database, allowing database searches based on germplasm performance within and between locations.
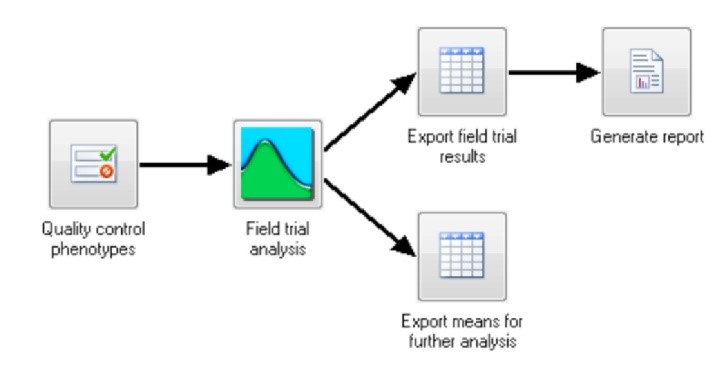
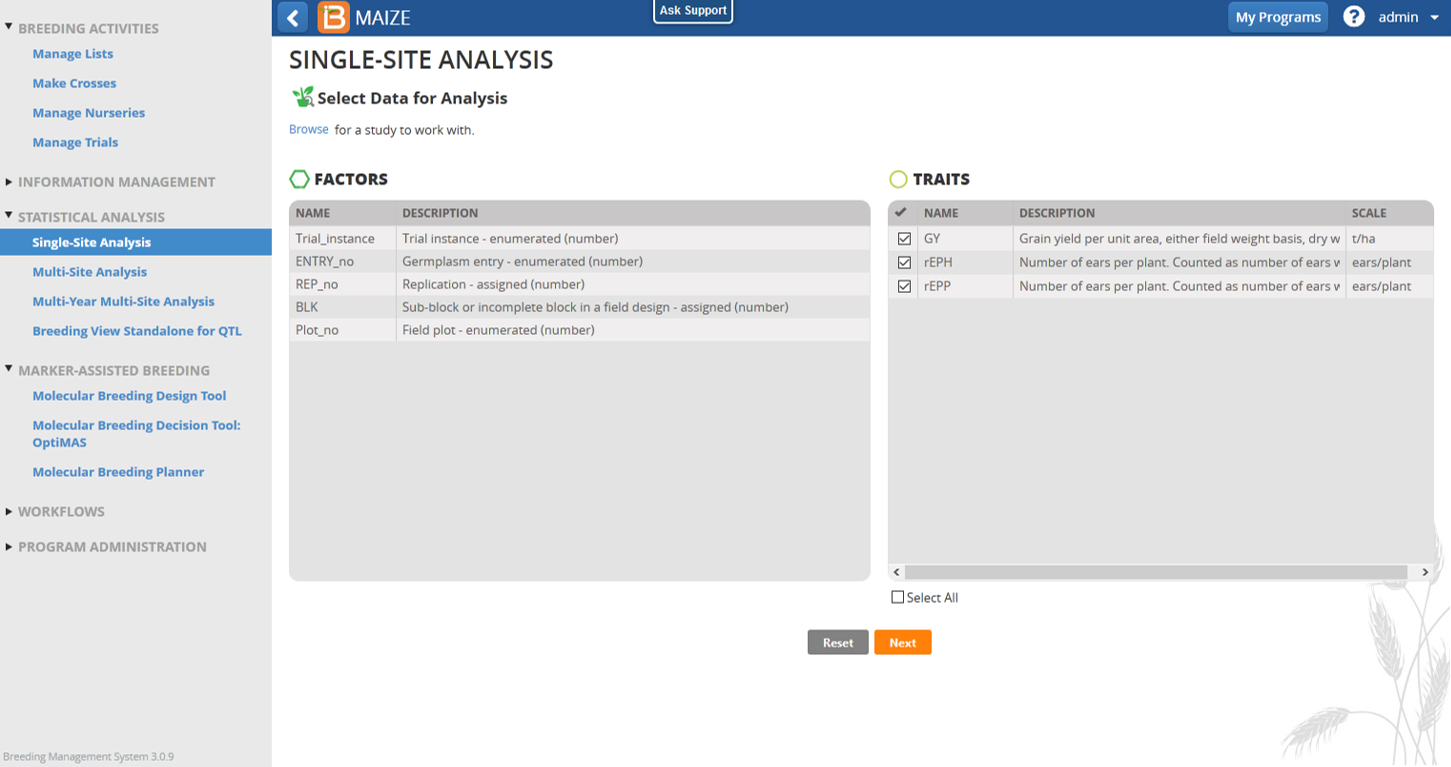
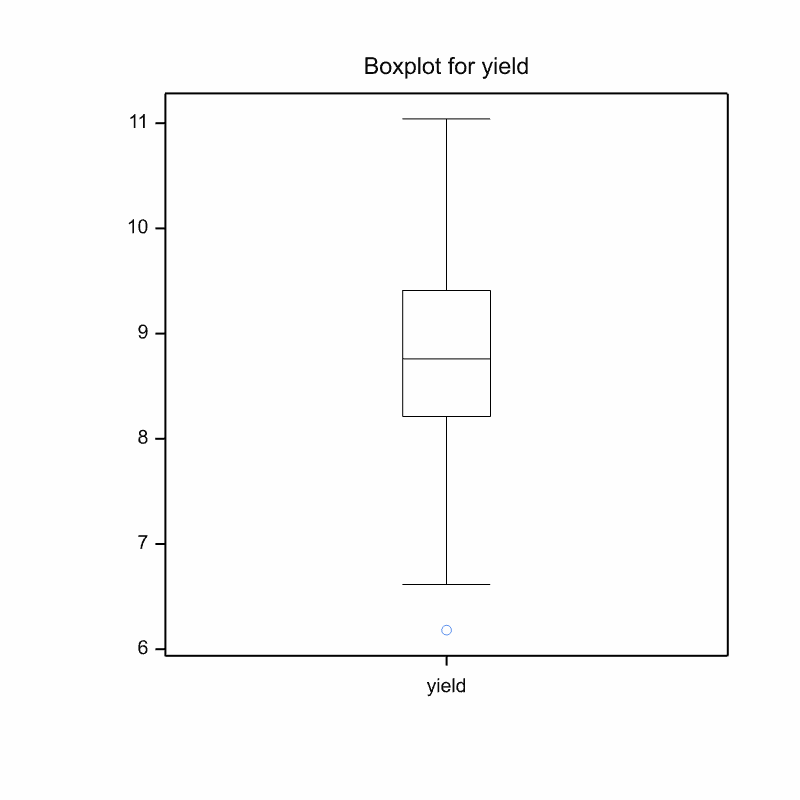
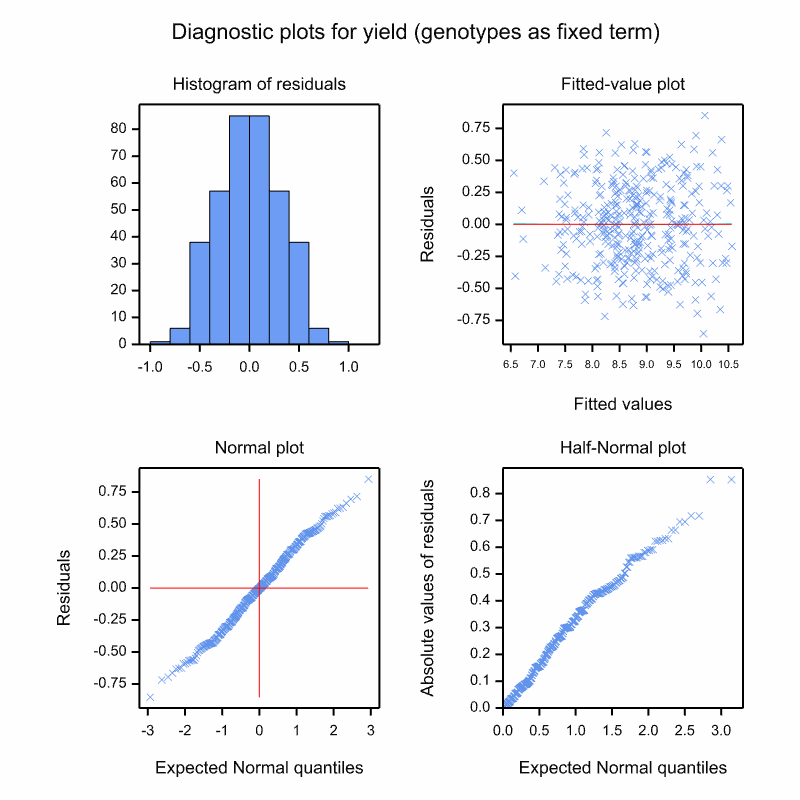
Fig.1 Single–site analysis – phenotypic analysis
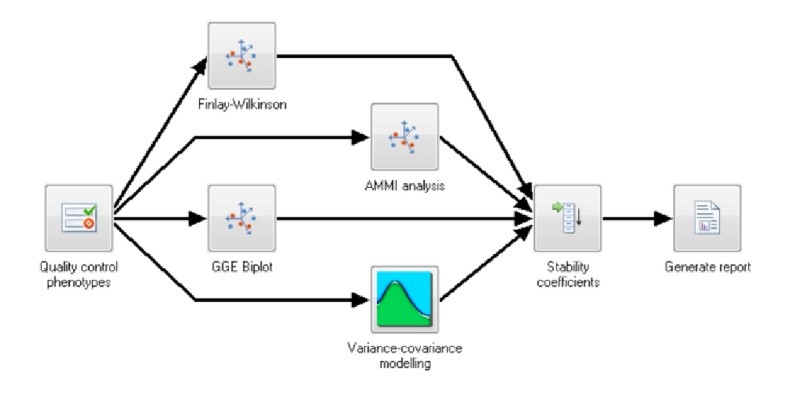
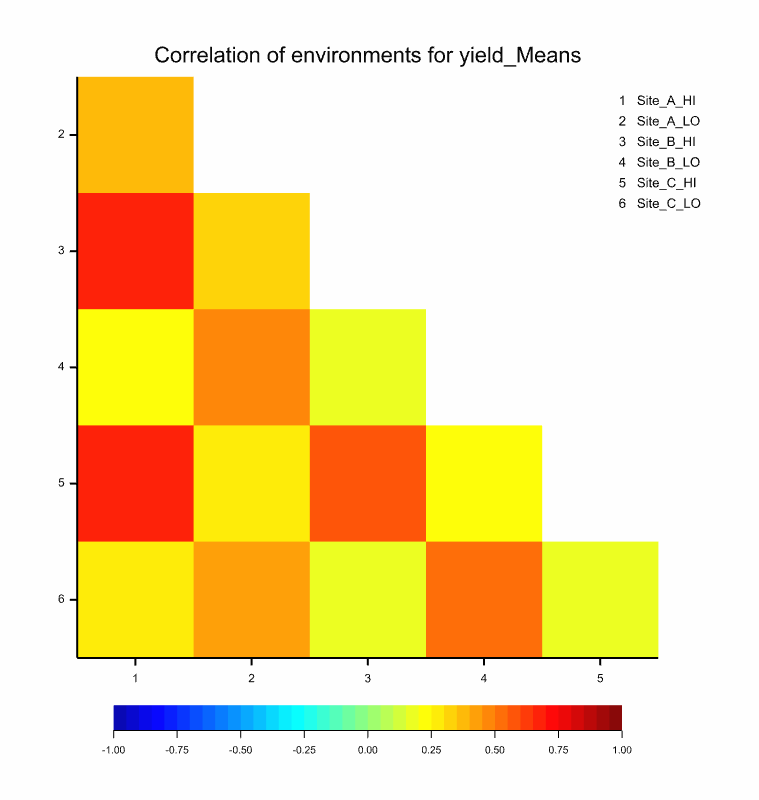
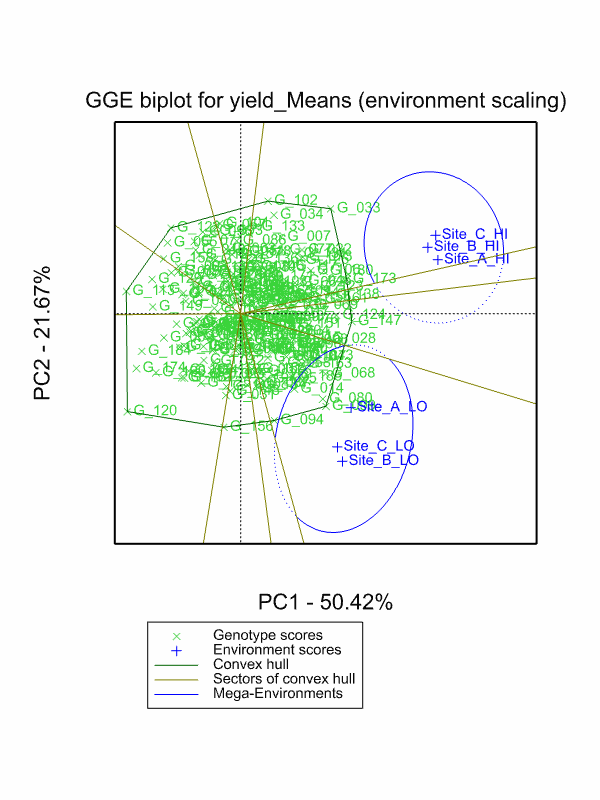
Fig.2 Multi–site (genotype by environment) analysis – phenotypic analysis
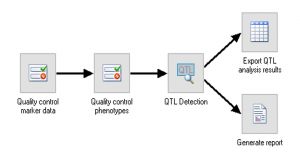
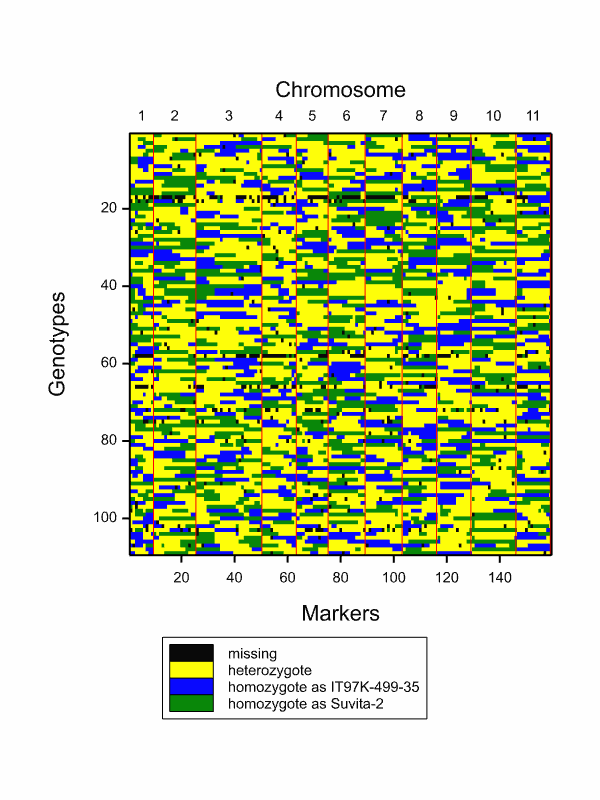
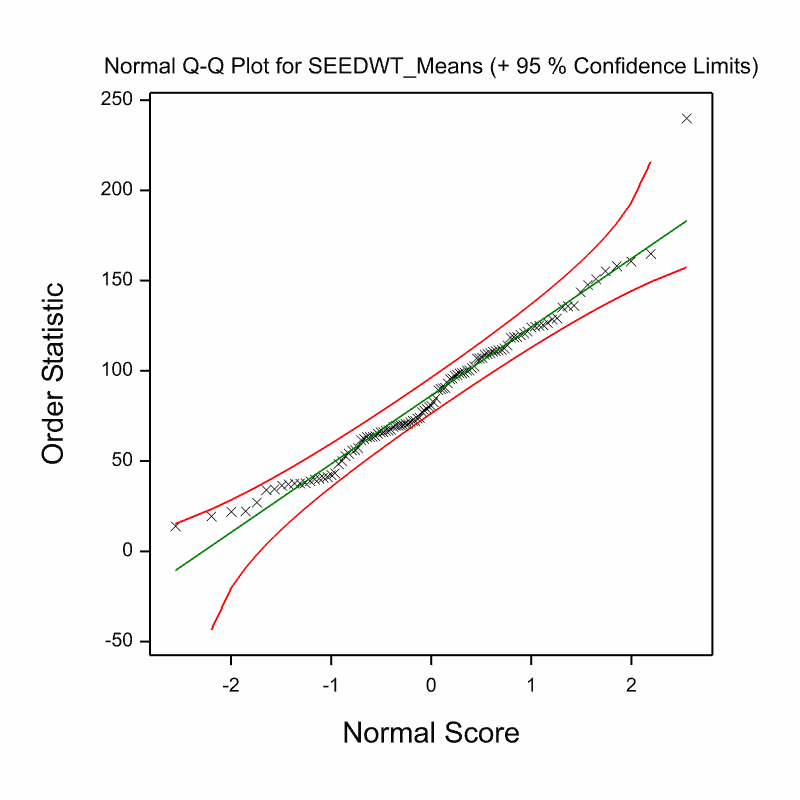
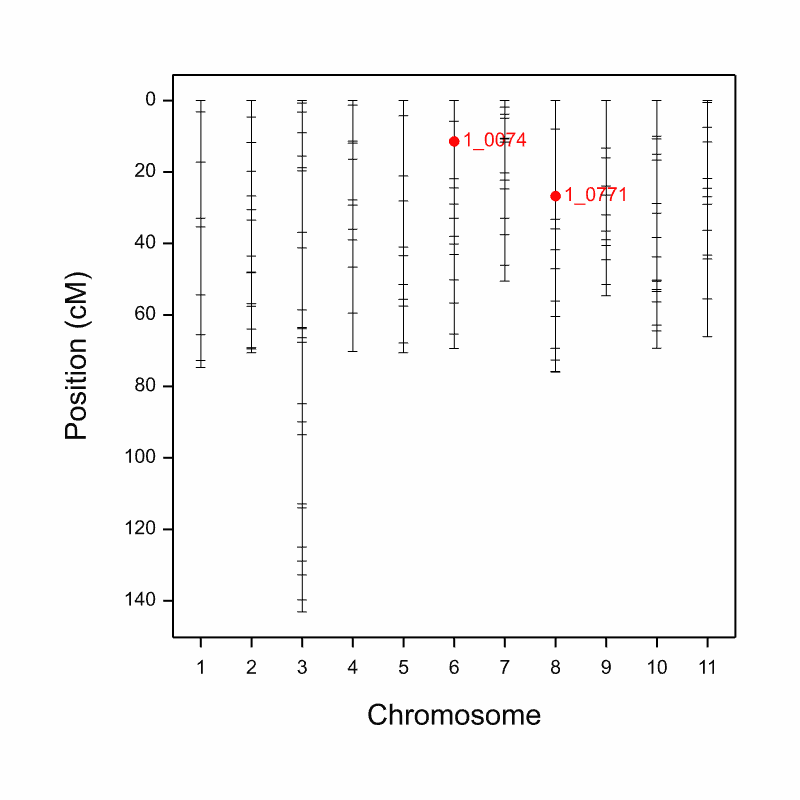
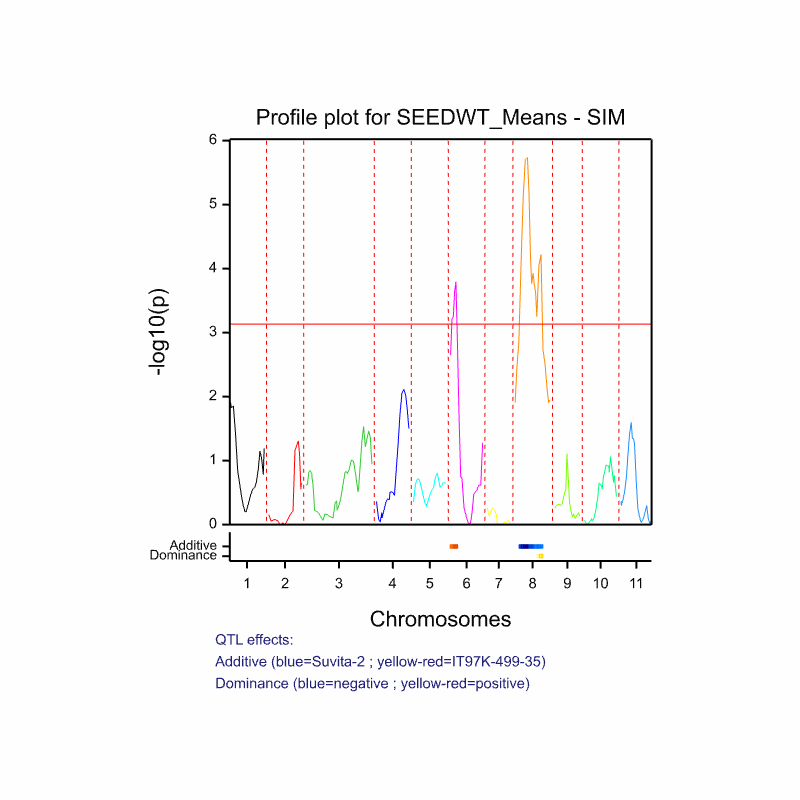
Fig.3 Single trait (single environment) QTL analysis using external sources of data.
QTL analysis with Breeding View
The BMS comes with a standalone QTL analysis package as part of the Breeding View statistical tool. Combine phenotypic, genotypic and linkage map information to identify potential quantitative trait loci (QTL) through simple and composite interval mapping. The QTL package creates a report with easy-to-interpret publication-ready graphics.
BMS Versions
Latest BMS version 3.0.9