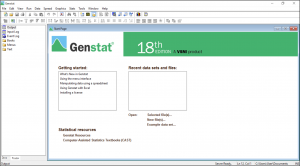
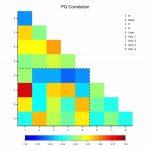
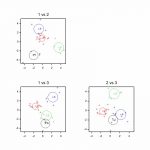
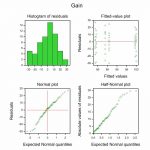
Genstat is a general statistics software for education and research. 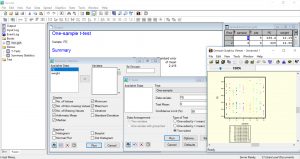 It is one of the earliest statistical systems and is one of the few to be developed outside North America. It has been developed since 1960 at Rothamsted Experimental Station for the experimental design and data analysis in agriculture. It is a very flexible and easy-to-use software that could be applied to any field of researches. It is built with the friendly user interface which contains of comprehensive menus to guide non-technical users to use statistics correctly and effectively. It also has a powerful programming language that can be used to develop new techniques and complicate experiments. Genstat provides full complementation of statistical procedures, data management, and graphical capabilities. It has powerful spreadsheet facilities for data storage and manipulation and an attractive graphics viewer that allows users to edit and interact with their plots.
Genstat provides a variety of descriptive statistics, tools for experimental design, generalized linear mixed models (GLMM),
 regression (linear, nonlinear and generalized linear), multivariate analyses, time series, statistical process control methods, survival analysis, spatial analysis and resampling methods. The strengths of Genstat® are ANOVA algorithm which analyses balanced multi-level data, the efficient REML algorithm which analyses multi-level data, allowing for correlated errors at any level of the data and good facilities for GLMs.
Genstat Feature
- Manage data on Genstat’s own spreadsheet
- Compatible with Excel spreadsheet (import/export)
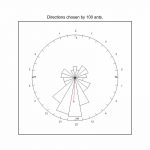
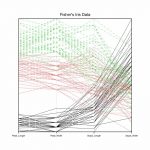
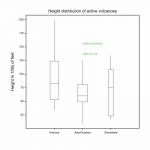
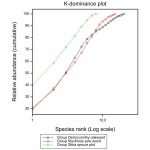
- Illustrate data with graphics such as histograms, boxplots, scatter plots, line graphs, trellis plots, contour and 3-dimensional surface plots;
- Summarize and compare data with tabular reports, fitted distributions, and standard tests, such as t-tests, tests and various non parametric tests;
- Transform data using a general calculation facility with a wide range of mathematical and statistical functions;
- Model relationships between variables by linear or nonlinear regression, generalized linear models, generalized additive models, generalized linear mixed models or hierarchical generalized linear models;
- Analyze experiments, ranging from one-way analysis of variance to complex designs with several sources of error variation, using a balanced-ANOVA or a REML approach (including the modelling of correlation structures);
- Design investigations deciding on the sample size, or numbers of replicates, required to detect the anticipated treatment effects;
- Identify patterns in data by means of multivariate techniques such as canonical variates analysis, principal components analysis, principal coordinates analysis, correspondence analysis, partial least squares, classification trees and cluster analysis;
- Analyze results from stratified or from unstructured surveys;
- Plot control charts, print Pareto tables and calculate capability statistics;
- Analyze time series, using Box-Jenkins models or spectral analysis;
- Analyze repeated measurements, by analysis of variance, or using ante dependence structure, or by modelling the correlation over time;
- Analyze spatial patterns, using Kriging or spatial point processes. These techniques are useful in agriculture, ecology, genetics, medical research, and other areas of biology, as well as in industrial research and quality control, and economic and social surveys; in fact in any field of research, business, government or education where statistics are used.
Genstat Versions
Latest Genstat version 18
